Monitoring DAP Traffic with DAPcell
Observing Concurrent DAPL Processing
The concurrent DAPL system processing takes care of real-time data acquisition complexities, but this benefit comes at a price: a certain level of obscurity. It is great while everything is working. Then, you make what you think is a trivial configuration change, and suddenly things don't work. The problem is usually simple to fix, but with no information about what went wrong, where do you start?
The latest DAPcell Services version 7.3 software, included in the DAPtools 6.30 release, integrates some new features to provide this kind of information. This is done in a completely noninvasive way, so that you don't need to modify your application code or your DAPL configuration script.
Go to the Windows Control Panel, and click on the Data Acquisition Processors Control Panel applet icon. A small window titled Data Acquisition Processors pops up. The rest of the story starts from this point.
Pipe Monitoring: What Was Really Sent?
A simple coding error in a command script can escalate to a show-stopper. It can help a lot to know exactly what commands the DAP board receives... as opposed to what the application thinks it is sending. To monitor the commands sent to the DAPL system, select the Browser tab in the Data Acquisition Processors window.
- Expand the "tree display" near the top of the Window.
- Expand the
DAPitem for your DAP board. - Expand the
Commpipesitem under your DAP board. - Click the
$SysInpipe to select it. - Right-click on the
$SysInpipe, and in the menu, clickView.
A new View window will pop up displaying the commands as sent to the DAP board. Here is an example.
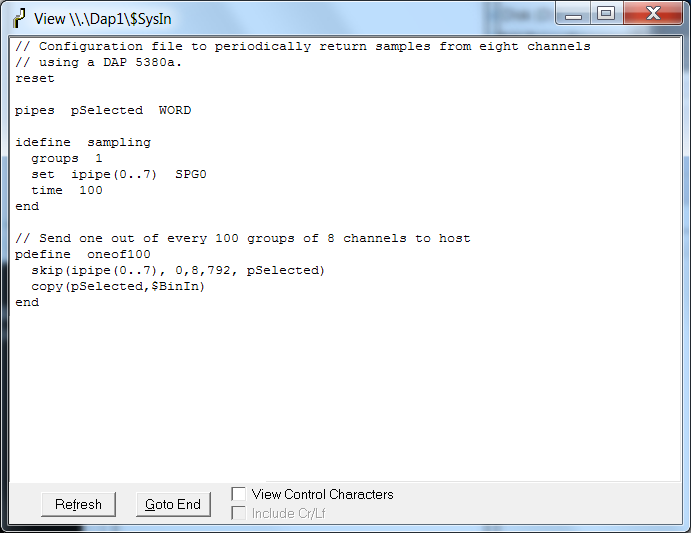
Hmmm... this looks perfectly OK. The commands all appear to be transferred correctly. But wait, the START command is missing. No wonder nothing was happening!
You can get a similar history for messages reported by DAPL processing back to the host. To do this, go to the DAPcell Service applet, but this time right click on the $SysOut pipe instead of the $SysIn pipe.
Here is an example of the display of the commands as echoed back from the DAPL system command interpreter. (You might need to include the command OPTIONS SYSINECHO=ON, ERRORQ=OFF in your configuration to see all of these lines.)
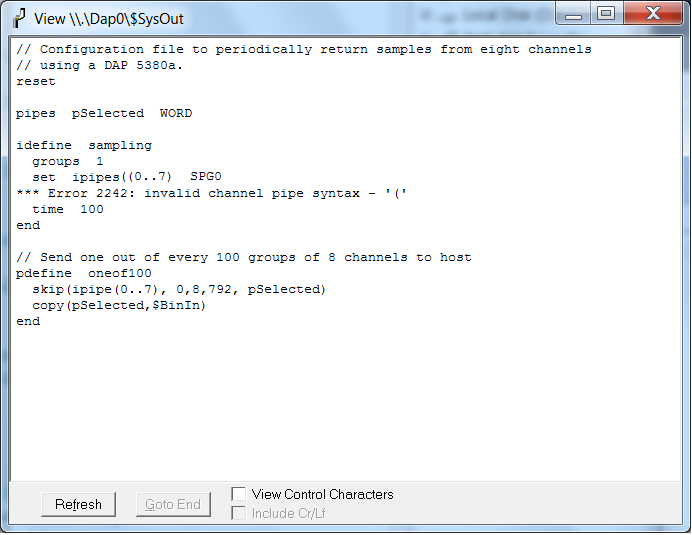
Did you notice that syntax error message? An obvious "typo". At least it is clear what needs to be fixed.
Capacity Monitoring: Can Processing Sustain?
A vexing problem can occur when DAP processing continues hour after hour with perfect results, and then, seemingly for no reason, it stops cold. The typical cause is a capacity limit, but it can be wickedly hard to diagnose.
A real-world example of this occurred when a DAP board was used to collect data for each car of a passing train. Data arrived faster than the processing could move it, but this made no difference — eventually, all data were processed and no harm done. But then, the train switchyard changed operating practices, and started moving much longer trains. When the unprocessed data exceeded available data storage capacity, mysterious data losses happened.
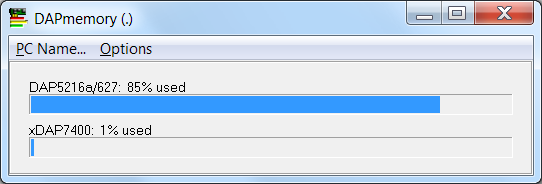
To monitor capacity, go to the Tools tab of the DAPcell Service applet. In the DAPmem box, click the Run button.
The bar graph in the DAPmemory window shows the relative amount of the DAP's filled and available buffer memory capacity. This is a live display, so it shows changes as they occur. If the display is visible when a new configuration is told to START, the filled capacity should show a rapid but small jump as memory areas are allocated for task management and internal processing. After that, the storage utilization for data should stay more or less level. The danger situation occurs when the levels of filled storage creep up and up — eventually leading to an overflow shutdown scenario.
There are multiple possibilities for fixing this:
- Correct any transfer rate inconsistency problems in the configuration.
- Optimize the processing configuration to use fewer tasks and internal transfers.
- Optimize the board-to-host transfers to make better use of host resources.
- Optimize the host application processing to pull in transferred data with fewer and shorter delays.
System Logs: A Timesaver
When it boots up, Windows is able to recognize that it has a PCI board, or a USB device, of a certain type. Then, it depends on the DAPcell software to finish by loading and starting the DAPL system, as appropriate for the hardware. If for some reason the Windows system fails to recognize the board type, it never invokes the DAPcell Service software, the start-up processing is not completed, and your applications won't run. You might also notice that the DAPcell window doesn't show the DAP board under its Browser tab, but there is no further indication of what went wrong.
Some important information is present in the Windows system logs, but each version of Windows seems to provide access to these logs differently. Still, if Windows never invokes the DAPcell Services, the Windows event log is one of the places to look to try to isolate the source of the problem.
Assuming Windows does recognize your DAP hardware, it will notify the DAPcell Service software of the newly available device and DAPcell will load the DAPL operating system to your hardware.
Just as Windows boots up when you start your machine, so does the DAPL system after DAPcell loads it to your DAP hardware. As DAPL boots and operates, it logs its activity to its own event logs. DAPL has two logs: a kernel log and a system log. The kernel log contains information about the DAPL system's internal operation, including its handling of hardware,.The system log contains application-level events recognized by the DAPL system.
You will not often need access to the kernel log. However, the system log can prove useful in diagnosing problems with your application configuration. Without modifying your application code in any way, you can use the system log to see errors generated by the commands your application sends to the DAPL system.
The new DAPcell Services window makes access to the DAPL event logs easier — at least for the DAPL 3000 system that fully supports the feature.
Click on the Browser tab and then do the following:
- Expand the "tree display" near the top of the Window.
- Expand the
DAPitem for your DAP board. - Click on the
Eventlogsitem. - Two options will be available here:
KernelandSystem.
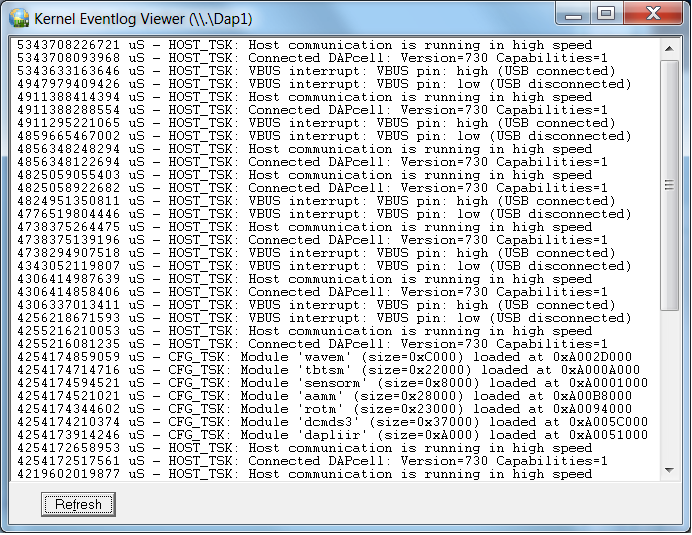
Kernel
Click the Kernel option to see messages related to startup initialization and drivers within the DAPL 3000 system.
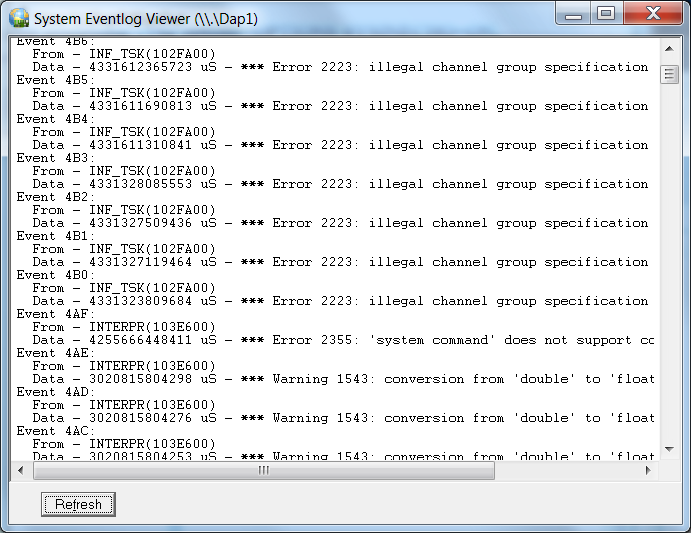
System
Click the System option to see the history of configuration and runtime errors as reported by the DAPL 3000 system.
Return to the Software Techniques page.