Q10069 Displaying FFT data
When I try to plot FFT data using DAP studio, the display flickers and jumps around erratically. What can I do to get clean, stationary displays?
If DAPstudio is allowed to treat blocks of FFT data the same as ordinary data streams, the erratic displays result. You can address this problem in the following ways.
Configure your FFT consistently
Be sure you select one of the output modes that produces real-valued, displayable results. Complex-valued output options typically look very much like normally-distributed random numbers. Your best output choices are magnitude (mode 5) or power spectral density (mode 4).
More is not always better. Screens have limited resolution, and only part of the screen typically is used for an FFT plot. A high-resolution FFT can waste a lot of data (and computations) because there is not enough room to display everything. A traditional 1024 point FFT gives data sets with block length 512 points, and looks good for most plots, but normally is not too wasteful. Sometimes a lower-resolution FFT graph appears more "solid" and easier to see.
How often does your display screen need to be refreshed? If you do this too fast, the eye (or the host computer) cannot follow, and the display will look like a blur. Four to five updates per second will look like a very busy display. But that means only 2048 to 2560 values are actually needed per second for producing displays. If you are sampling at very high rates (which you must do to resolve high frequencies with your FFT) you can easily collect vastly more raw samples than graphics displays can use.
Things you can do to reduce the amount of data delivered for plotting:
- If you have relatively stationary signals, you can use a
BAVERAGEcommand to combine several magnitude (mode 5) or power spectral density (mode 4) FFT blocks. (You cannot average complex FFTs together in general, because phase angles vary and cause the average to converge to zero.) - If signals change their character too quickly, you can use the
SKIPcommand in your DAPL processing to select blocks of data periodically.
Configure your plot graphics
Here are some adjustments you can apply in DAPstudio to get more viewable graphs that do not scroll continuously. Open and double-click on the Graph window to bring up a configuration dialog.
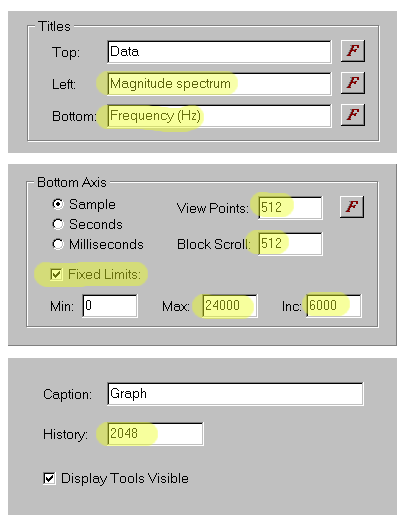
- Force each FFT block to fit exactly in the graph by setting the View Points number to an even multiple of the FFT block length — typically, equal to the FFT block length.
- Set the History (number of retained past values) to an even multiple of the FFT block length.
- Set the Block Scroll parameter equal to the FFT data block size, to force each new data block to align to the same starting position.
- To keep the X-axis labels from incrementing, check the Fixed Limits box at the bottom of the plot configuration dialog.
- To label the X-axis with frequencies in Hz, determine the time interval between samples used as the input data to the FFT; take the inverse of this, and divide by 2 to obtain the The Nyquist limit. Enter that as the Max limit for your spectrum block. Pick a value of Inc that is a convenient nice fraction of the Max value.
- If you apply a sine wave of known reference magnitude, you can calibrate a scale factor for the Y axis and make similar adjustments to the Full Scale parameter in the vertical axis direction.
- Label the Left axis as
MagnitudeorPower Spectral Densityaccording to the FFT option you are using. - The
MIXRFFTcommand in DAPL 3000 can be helpful for aligning specific frequency ranges to specific plot sizes. - For plotting multiple spectra, try the 3D Plot option.
L24215
DAPstudio file Q10069-fft.dms shows a simple application example with FFT displays.
See the DAPstudio manual for more details about using DAPstudio software.
See the DAPL reference manual for more details about configuring FFT processing commands.