Graph your data in DAPstudio
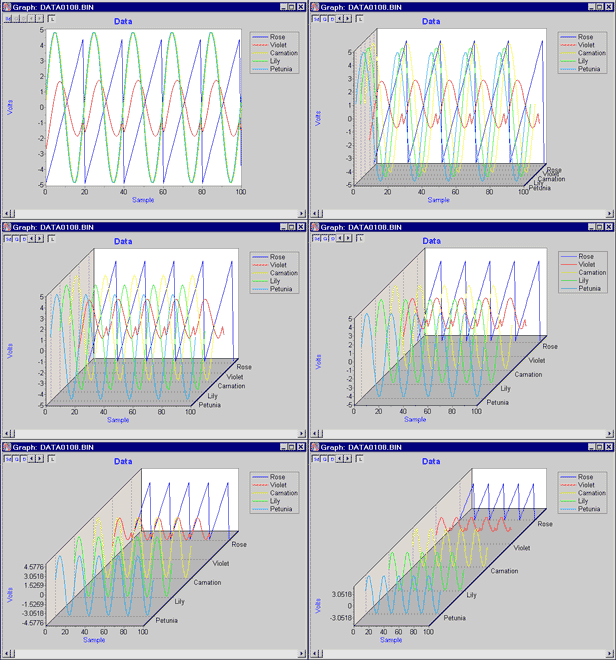
The Graph window displays graphical representations of data acquired and processed by the DAP board.
With DAPstudio you can process massive files of acquired data and access any part of them instantly. In the Graph window, rapidly display even multi-GB data files.
Customize the display for your requirements. Configurable options include the visual (3D display, background color, titles, captions, channel colors) and the practical (history length, units of measurement, types of measurement).
