Tuning PID Control by Simulation
Technical Note TN-031 Version 1.10
View more Control information.
Introduction
|
Related Product |
|---|
The PID1 command of DAPL provides a compact and simple means to implement a single variable PID (Proportional-Integral-Derivative) controller. Since a controller defined by DAPL is a software task, rather than specialized hardware, one Data Acquisition Processor™ can control many processes as easily as one. A control system using DAPL can also take advantage of the high speed data capture, interactive graphics displays, data logging, and process monitoring features that a Data Acquisition Processor provides.
The performance characteristics of the controller and the system to be controlled are both important. This Technical Note will help to explain how a DAPL PID1 task operates in a process control system, and how to tune parameters using a simplified process model. Examples at the end of this note illustrate the tuning technique for three types of systems.
Control Systems Background -- The Regulation Problem
In a regulated system, an input signal called the setpoint specifies the desired response level at the system output. The output could be a temperature, the flow rate in a pipe, or the position of a cutting tool, to name just a few possibilities. In a perfect world, you would provide the setpoint signal to the system input, and it would immediately provide the desired output level. This configuration, sometimes called open loop control, is illustrated in Figure 1.

Figure 1. Ideal system and open loop control.
Very often, real processes cannot be operated in this way. The output may drift away from the setpoint for a variety of reasons, or may respond too slowly to changes, or may oscillate too much in response to transient changes. In these situations, the output of the system can be measured and processed by a separate controller (sometimes called a regulator). The controller compares the system output to the setpoint level to determine a new control input for the system. This configuration, called closed loop control, is illustrated in Figure 2.

Figure 2. Typical system under closed loop control.
Various strategies have been used to implement the controller. Three of the most common are:
- (P) Proportional error correction. The difference between the setpoint and actual system output is amplified and fed back to provide the correction signal. The larger the deviation from the setpoint, the larger the correction signal.
- (I) Integral error correction. Persistent differences between the setpoint and actual system output accumulate over time, until they become large enough to drive the system output back toward the setpoint.
- (D) Derivative error correction. The correction signal opposes rapid deviations in system output, reducing the response to disturbances and transient conditions.
There is nothing that requires these strategies to be utilized in isolation. Usually, some combination provides better performance. The multipliers P, I and D specify the degree to which each of the correction terms affects the controller's output. Figure 3 shows a simplified block diagram of a PID controller.
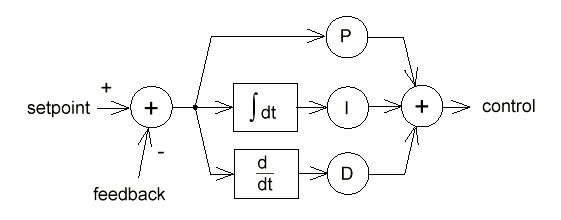
Figure 3. Simplified block diagram of the DAPL PID1 controller.
Another common nomenclature for PID control parameters is given below. The configuration is the same as Figure 3, with parameter conversions given by:
- P = Kc I = Kc / Ti D = Kc Td
- Kc = P Ti = P / I Td = D / P
Applying the PID1 Processing Command
The DAPL implementation of PID in the PID1 command is slightly different from a conventional PID controller. The Data Acquisition Processor is a computing device, so instead of operating directly on voltage signals, it actually operates on digitized samples using fixed-point arithmetic. A detailed block diagram of a DAPL PID controller is provided in Figure 4.

Figure 4. Detailed block diagram of DAPL PID1 controller.
A DAP requires an external sensor to measure the system output and signal conditioning electronics to convert the measurement to an appropriate voltage for digitization. The sensor and signal conditioning are represented in Figure 4 by the Si scaling factor. The voltage is typically a single-ended voltage in the range -5 to +5 volts. It is sampled by an A/D converter under control of a DAPL input procedure.
The numerical output of the PID1 task is converted to an output voltage by a D/A converter. The output voltage range is typically -5 to +5 volts. Figure 4 represents the output range limits as an explicit limiter block. External electronics may be required to convert the output voltage into a signal suitable for driving the system input. The output scaling introduced by the external electronics is represented by the multiplier So in Figure 4. If possible, the output scaling should take advantage of the output range limits, to protect system devices from excessive control signal drive. For good transient response, the scaling also should allow some room for short-term control signal levels which significantly exceed the normal range.
The PID controller calculations proceed at the rate that data samples are placed into the PID input pipe. The sampling rate should allow sufficient time for the system to respond between samples, but should be sufficiently fast for observing system changes as they are happening. In the examples at the end of this note, the controlled processes require a few seconds to respond to input changes, so the PID samples are captured at tenth of a second intervals. The T notation in Figure 4 represents sampling time.
The Integral and Derivative control calculations do not include the element of time, which must be introduced by scaling the PID coefficient values. The next few paragraphs will explain how the scaled coefficients Ps and Ds shown in Figure 4 are related to the P and D parameters in Figure 3.
The integral operation is approximated by summing the values of the error input, and then applying the Is multiplier. The relationship between the real time system coefficient I and the sampled coefficient Is is
Is = I * T
To understand what this represents, suppose that the sample time T is reduced by half, causing the sample rate to double. The summation approximating the integral will then be updated twice as often, causing it to grow twice as fast. Without any correction, this increased growth would lead to a doubling of the integral control effort. The T term in Is above compensates for the faster growth.
The derivative is approximated by differences of consecutive inputs. The relationship between the real time Derivative coefficient and the sampled Derivative coefficient is
Ds = D / T
Again suppose that the sample rate is doubled. The Derivative term observes the input twice as often, so it sees changes of roughly half the size at each sampling interval, and without compensation it will produce about half the effective control response. The 1/T term in Ds above compensates for the smaller change observed between samples.
The proportional gain parameter is not affected by sample time.
Ps = P
Tuning PID Parameters
Selecting optimal values for the P and D parameters of a closed loop control system is usually an iterative process. This process is called PID tuning.
Before tuning begins, verify that all components of the control loop operate correctly. Test input processing tasks to verify that the measurements of system output are sampled correctly. Test output procedures to verify that the control output is correctly scaled. Verify that the PID controller processes the sampled input and produces an output sequence which is consistent with the input. If possible, verify that the system responds correctly to its control input.
Knowing that the components work individually still does not guarantee that they will work together. How do you establish initial parameter settings and evaluate closed loop operation without driving the actual system? You can use the multi-tasking capabilities of DAPL to simulate the essential characteristics of your system under closed loop control, using the PID parameters that you specify. Then, when you are satisfied that the settings are reasonable, you can disconnect the simulated system and connect the real system in its place.
The DAPL commands provided in Listing 1 at the end of this note simulate the response of an inertial third-order linear system under closed loop PID control. The simulated system samples its control input from analog input channel 0 and sends its output level to analog output channel 0. The PID controller samples its input from analog input channel 1 and produces a control output on analog output channel 1. A sample time of 1/10 second is used both for the PID controller and for the simulated system.
Some simple hardware connections are required to run the simulation. Connect an MSTB 003-01 termination board to a Data Acquisition Processor. Connect output pin DAC1 to input pin S0, to route the output of the simulated system to the input of the PID control. Connect input pin S1 to output pin DAC0, to connect the input of the simulated system to the output of the PID. After your tuning is completed, remove the connections to S1 and DAC1. Replace them with connections from your system output voltage to S0, and from DAC0 to your system control input.
You will want to edit some of the coefficients in Listing 1 to configure the operation of your PID controller and simulated system. The variables A0 and B3 specify the behavior of the system, in the form of a Laplace transform
(A2 s2 + A1 s + A0) / (B3 s3 + B2 s2 + B1 s + B0)
(Don't worry if you are unfamiliar with Laplace transforms and the s variable; you can use and modify the coefficient values from the three test cases at the end of this note.) The SETPT variable specifies the setpoint. The variables PV, IV and DV specify the PID response characteristics, and the variable RAMP sets the maximum setpoint ramping change per update.
That's all you need. Download the edited DAPL program, run it under DAPview, and display PSET, PIDIN, and PIDOUT. The setpoint level will plot as a blue line, the system response will plot as a red line, and the PID control output will plot as a green line on your DAPview display.
Test Cases
The following test cases illustrate PID control for three typical systems. These cases show the capabilities and the side effects of each of the three kinds of feedback control. The units on the vertical scale of the output plots shown in Figures 5 through 15 represent the digital values provided to the D/A output stage. In the figures, the system response is plotted as a bold line, and the PID control output is plotted as a thin line. The controller is limited to the range -20,000 to 20,000 in the test cases. You can edit the system response and PID control variables as you wish, but the rest of the listing should require no changes.
One of the figures for each test case shows the response of the system without PID control. To replicate these graphs, you must override the feedback signal, temporarily replacing the command VIN=PIDOUT with the command VIN = SETPT.
Test Case #1 -- Sluggish first-order system, about 10 second time constant.
    A2=10  A1=0  A0=0
    B3=100  B2=10  B1=0  B0=0

    PV=100  IV=0  DV=0
    RAMP=10000

        10
    -----------
     100s + 10
Without a controller, the system responds very slowly, as shown in Figure 5.
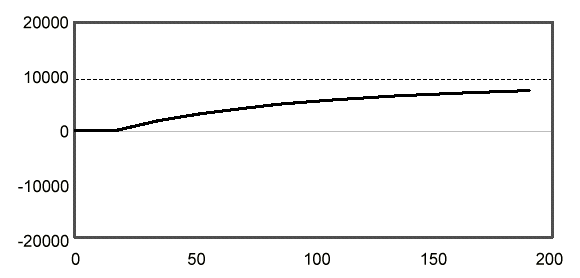
Figure 5. Slow step response without PID control.
Applying PID control with the settings given at the beginning of this test case, we get the response shown in Figure 6. The Proportional control gain is unity, which is a low value, so the response is still sluggish. Each unit that the system approaches the setpoint produces a unit drop in control effort. The system and controller balance halfway between 0 and the setpoint -- not a very acceptable result! Note that a sustained control effort is required to maintain systems such as this one at any nonzero operating point. For example, holding a temperature might require a sustained flow of power to a heating element.
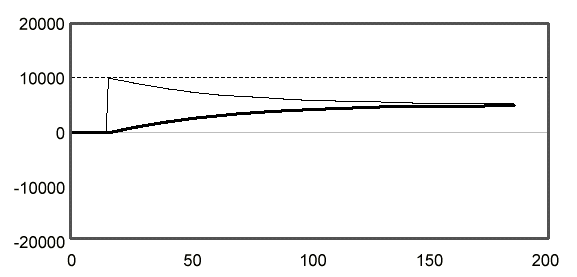
Figure 6. Sluggish system response with low proportional correction
To reduce the difference between the setpoint and output, we first try increasing the Proportional control gain to 8, by setting PV=800. The results are shown in Figure 7. The increased control effort moves the system output much more quickly. Notice that the PID control effort jumps immediately to maximum and stays there for a significant length of time. Setting a higher gain would therefore have little effect: maximum effort is maximum effort at any gain setting. If we wished, we could raise the effective maximum control effort by rescaling the input, output, and setpoint to avoid saturation. On the negative side, higher gains can be seen to cause increased noise in the control signal.
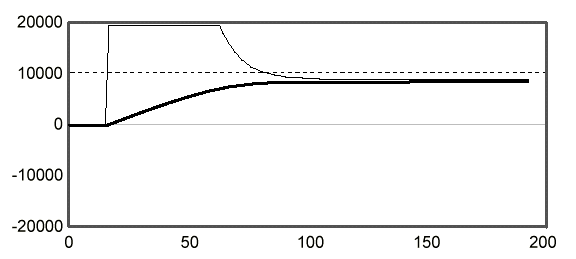
Figure 7. Better system response with higher proportional correction
If you examine Figure 7, you will notice that the system still does not reach the setpoint level of 10,000. As the system approaches the setpoint, the control effort drops away. We can correct this problem by introducing some Integral correction. Setting IV=300, we obtain the response curve shown in Figure 8. As long as the system operates below the setpoint, the Integral correction increases until the system reaches the setpoint.
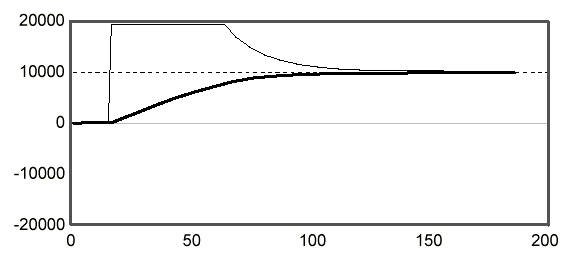
Figure 8. Adding integral control corrects the offset.
Test Case #2 -- Lightly damped, integrating, second order system.
    A2=0  A1=0  A0=6
    B3=2  B2=5  B1=5  B0=0

    PV=100  IV=0  DV=0
    RAMP=10000

              6
    -----------------------
     2 s**3 + 5 s**2 + 5 s
This system will stay at the setpoint without any control effort. But getting it there can be interesting, because once this system starts to respond, it tends to keep going. Figure 9 shows the unstable response without PID control.
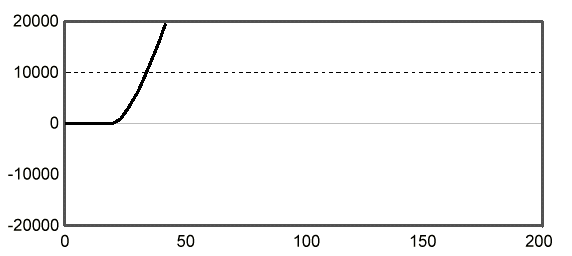
Figure 9. Integrating system goes unstable without controller
To get the system to the setpoint quickly, the usual strategy is to apply Proportional control. Using the coefficients given at the beginning of this test case, the unity Proportional gain causes the system to overshoot the setpoint of 10,000. The system oscillates for a significant time, as shown in Figure 10.
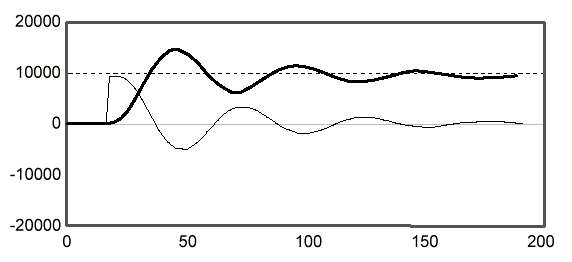
Figure 10. Oscillations in integrating system with proportional control.
Increasing the gain to PV=150 only makes the oscillations worse, as shown in Figure 11.
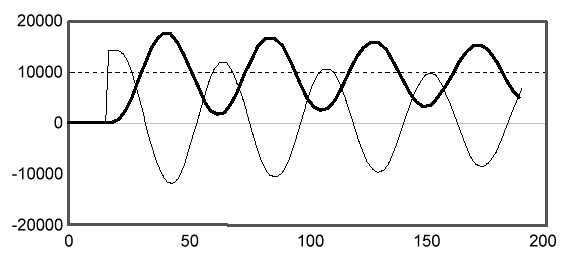
Figure 11. Increasing proportional gain worsens oscillations.
For this kind of system, a large control effort is not necessary to reach the setpoint. The best strategy is to reduce the proportional gain, and add Derivative feedback control to dampen the oscillations. Setting the proportional gain to PV=65 and the derivative gain to DV=425, we see the response shown in Figure 12. Derivative gain is very effective at controlling oscillations, but too much makes the system sensitive to noise, and slows the approach to setpoint.
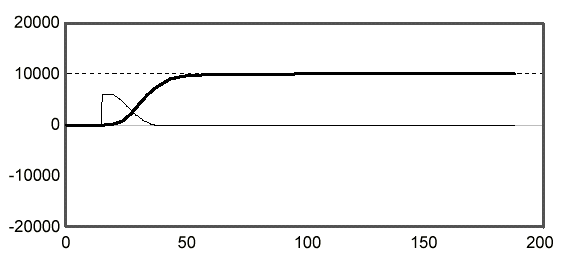
Figure 12. Control results with proportional and derivative gains.
Note that the Integral correction term was not used. For natural integrating systems such as this one, Proportional correction is all that is necessary to reach the setpoint. If the system has a tendency to oscillate, as this one does, the Integral correction will tend to increase the oscillation. As an experiment, you might want to try setting parameter IV=200 to observe the change in response.
Test Case #3 -- Slightly underdamped oscillation riding on a gradual exponential rise.
    A2=1  A1=11  A0=3
    B3=15  B2=18  B1=25  B0=3

    PV=100  IV=0  DV=0
    RAMP=10000

           s**2 + 11 s + 3
    ------------------------------
     15 s**3 + 18 s**2 + 25 s + 3
The open loop response of this difficult system is shown in Figure 13. The system is very slow to approach the setpoint, yet at the same time it is prone to oscillate. A system such as this is almost impossible to operate without using feedback control.
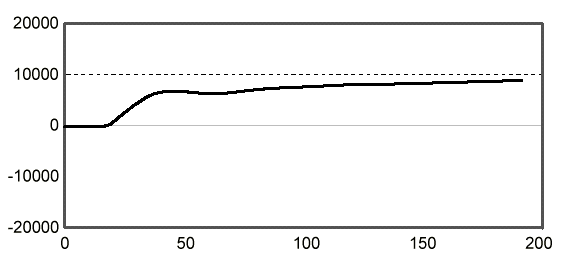
Figure 13. Step response of third-order system without controller.
Using the PID parameter values given at the beginning of this test case, the low value of Proportional correction allows the system output to settle far from the setpoint, much like the system of Test Case #1. Applying more Proportional error correction, and setting PV=600, we get closer to the setpoint, but also excite oscillations, as seen in Figure 14.
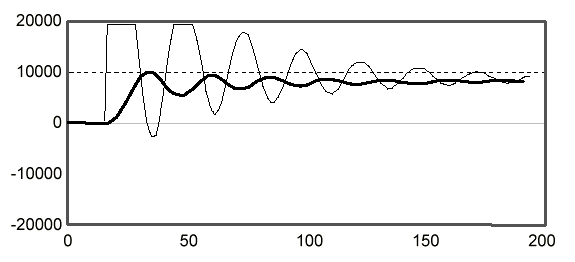
Figure 14. Response of third-order system to increased proportional gain.
Adding a large Derivative correction, we can both reduce the oscillations and allow a higher value of Proportional gain, at the expense of some increased levels of control signal noise. Also notice that like Test Case #1, this system also tends to settle to an output level different from the setpoint. Integral gain can correct this, but this setting interacts with the proportional and derivative settings. Adjusting the gain settings to the values PV=500 , IV=6000 , and DV=2000 , we get the output response shown in figure 15.
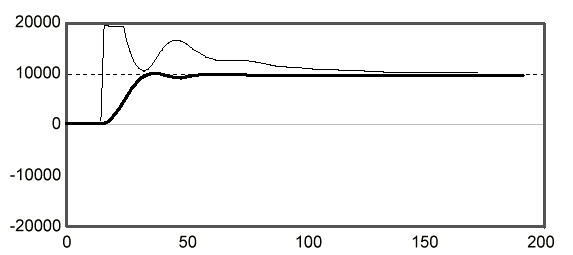
Figure 15. Response of third-order system with tuned PID control.
Conclusion
With the unsurpassed flexibility provided by a Data Acquisition Processor-based system, and with the control capabilities provided by the PID command of DAPL, there is no longer any reason to settle for control systems with lesser capability. Under DAPL, one Data Acquisition Processor can control one PID process loop or dozens of them with equal ease, replacing a rack full of specialized controller modules. Adding a new control loop is simple by using DAPL to specify the input channel, the output channel, and the PID control process parameters. The Data Acquisition Processor can perform exceptionally high-speed or exceptionally low-speed PID control tasks beyond the capabilities of conventional controllers. Furthermore, the Data Acquisition Processor can take care of the monitoring and data functions that must normally be provided by separate data logging devices.
With conventional PID controllers, it can be difficult to know what control system performance to expect without actually building and running the closed loop control system. With a Data Acquisition Processor, however, DAPL can simulate closed-loop system response, using the PID control strategy that you specify. Simply use the DAPL commands described in this note to simulate some of the essential features of your system's response -- sustained control effort, response time, and tendency to oscillate. You can experiment freely with PID control, evaluate the effects of control limits, get some valuable practice at fine-tuning control parameters, and obtain a high degree of assurance that your closed loop control system will be well behaved.
Listing 1 -- DAPL Code for Closed Loop PID Control Simulation
; **********************************************
; DAPL Closed loop simulation of 3rd order
; inertial system and feedback control using
; the PID1 command.
; **********************************************

RESET
OPTION SCHEDULING=FIXED

; The object of this simulation is to adjust
; the following three gain coefficients and the
; constant ramping limit to bring the system
; response line even with the desired system
; setpoint line as smoothly and quickly as
; possible.

VARIABLE PV=500, IV=2000, DV=600
CONSTANT RAMP=400

; Coefficients for system transfer function simulation.
; Edit these to describe your simulated system response.
;
VARIABLE A2=1, A1=11, A0=3
VARIABLE B3=14, B2=12, B1=24, B0=2
;
;          A2**2 + A1 s + A0
; -----------------------------------
;    B3 s**3 + B2 s**2 + B1 s + B0

; **********************************************

; Other PID control variables
VARIABLE LOCK=1
VARIABLE SETPT=0

; Pipes for system simulation.
PIPES VIN, VOUT, VFB
PIPES LS1 LONG, LS2 LONG, LS3 LONG
PIPES AUX1, AUX2, AUX3

; Pipes for PID feedback control
PIPES PIDIN, PIDOUT, PSET

; Dummy data for real-time synchronization
PIPES SYNC, PIDX

; Establish initial conditions
; for system simulation integrators.
FILL AUX1 0
FILL AUX2 0
FILL AUX3 0
FILL VFB 0
FILL VIN 0
FILL VOUT 0

; **********************************************

; Simulate data capture by synchronizing to the following
; sampling procedure. The sample values are not used.
; The COUNT command terminates the simulation.
IDEFINE SAMP 2
  SET IPIPE0 S0
  TIME 500
  COUNT 8000
  SYNC = (IP0 & 0) + 1
  END

; **********************************************

; PID control.
PDEFINE CONTRL
  SKIP(SYNC,0,1,19,PIDX)
  PIDIN = PIDX * VOUT ; Feedback from system
  PID1( PIDIN, SETPT, PV, IV, DV, \
     LOCK, PIDOUT, -5000, 20000, RAMP)
  VIN = PIDOUT
  PSET= PIDX * SETPT
  MERGE(PSET,PIDIN,PIDOUT,$binout)
  END

; **********************************************

; System simulation by integration of state equations.
PDEFINE SYSTM
  AUX1 = (VIN*A0 - VFB*B0)/B3/10
  INTEGRATE(AUX1,LS1)
  AUX2 = ((VIN*A1 - VFB*B1)/B3 + LS1)/100
  INTEGRATE(AUX2,LS2)
  AUX3 = ((VIN*A2 - VFB*B2)/B3)/10 + LS2
  INTEGRATE(AUX3,LS3)
  VOUT = LS3
  VFB = LS3
  END

; Start system and controller
START SAMP, SYSTM, CONTRL
PAUSE 300 ; system starts with control locked
LET SETPT=10000 ; change setpoint
LET LOCK=0 ; unlock PID control

; End of simulation
Contents copyright © 1997, Microstar Laboratories, Inc. All rights reserved. No part of this publication may be photocopied, reproduced, or translated to another language without prior written consent of Microstar Laboratories, Inc. Microstar Laboratories assumes no responsibility for damages due to errors or omissions. Microstar Laboratories, Accel32, Data Acquisition Processor, DAP, and DAPL are trademarks of Microstar Laboratories, Inc. Other brand names and product names are trademarks of their respective holders.
View other Technical Notes.
View other Control Information.
View Product Information.
View Technology.
