Power system harmonic analysis
The Problem

(View more articles related to DSP or Integrated Systems.)
Power system loads often exhibit nonlinear characteristics such as magnetic saturation, resulting in distorted voltage and current waveforms that can interfere with other service on the power system. The first step in controlling the distortions is measuring them accurately. This seems like a relatively easy application for Fourier analysis. For example, collect 256 samples that span one power cycle at the fundamental frequency. A 256-point FFT would then deliver an analysis of the first 128 harmonics, more than enough to cover the 40 to 50 useful for a harmonic distortion analysis.
While the basic idea is good, this turns out to be seriously over-simplified, and measurements obtained that way would be unsatisfactory. The rest of this note discusses how to extend the basic idea so that it yields fully satisfactory results. Actually, the results can be much better than merely satisfactory. How much better might surprise you.
Hazards and Solutions for FFT Harmonic Analysis
The idea of applying an FFT for a spectrum analysis is good, but care is needed. To begin cataloging the difficulties and the solutions:
- Transient noise. The ordinary chatter of various small transients from circuit switching, regulation, and load disturbances should not make any significant difference. With small data sets, the results are sensitive to these disturbances.
Solution. Averaging can reduce the effects of the small random disturbances, so a good test must cover data from multiple power cycles. Standards typically require a minimum of 4 cycles per analysis. Using more cycles is better. - Subharmonic and modulation effects. Some power system disturbances result from coupling to dynamic systems whose modes produce off-harmonic effects. These effects distort the FFT's harmonic profile.
Solution. It is not possible to compensate for the modulation effects, but modulation disturbances tend to spread their energy across a band of FFT locations. If the FFT has high resolution, most of the disturbance energy appears at locations that are not relevant to harmonic analysis, reducing the impact on the important harmonic frequencies. High resolution in an FFT corresponds to a longer analysis block. - Frequency drift. The fundamental frequency of the power system is a nominal figure that represents a long-term average but not necessarily an accurate short-term condition. Frequency drifts a significant fraction of a percent above or below the nominal operating frequency during normal operation.
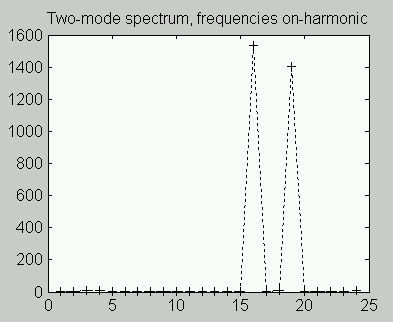
When the harmonic frequencies match the discrete frequencies of an FFT exactly, the harmonics appear as a precise "picket fence" in the spectrum, with intermediate frequency terms zero, as in the following plot.
After frequency drift shifts the harmonic frequencies so that they no longer align with the FFT, the FFT attempts to represent them as an artificial combinations of other frequencies. This causes an apparent "smearing" of the harmonic peaks, making the true harmonics difficult to quantify. Observe how the peaks are reduced, wider, and have their energy "smeared" into side bands.
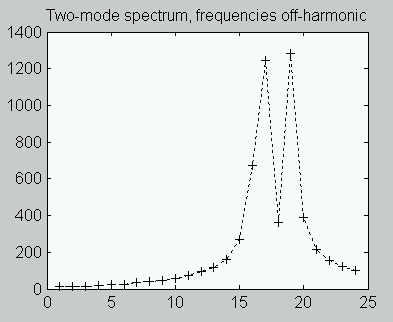
Frequency shifts have little effect on the lower harmonics, but higher harmonics can be shifted into completely different FFT locations, seriously impacting a high-resolution FFT analysis.
Solution. Align the sampling frequency to the current power frequency. This forces the harmonic frequencies to stay aligned with the correct discrete frequencies analyzed by the FFT. - Block truncation. An FFT analysis chops a signal into discrete data blocks that are supposed to contain exact multiples of the waveform cycle. If a cycle is incomplete, or if there are a few samples from the next cycle, this can cause a response in the FFT analysis much as if a transient disturbance arrived at the very end of the block. The artificial disturbance can have a very significant effect on the apparent magnitudes of harmonic frequencies, destroying the accuracy of the analysis.
Windowing Solution. A DSP windowing operator has the property that it attenuates disturbances at the ends of data blocks, and this can be used to advantage to suppress the artificial transient disturbances. This is the traditional DSP solution, but, unfortunately, windowing has the side effect of losing good information as it suppresses bad artifacts. The following plot shows the distorted spectrum resulting from frequency shift, and the correction that windowing provides.
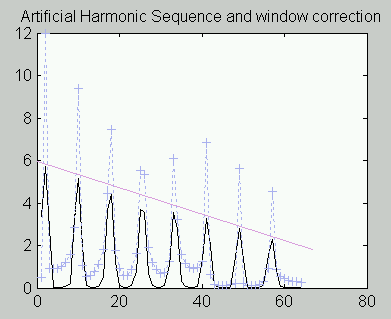
For this particular test case, a perfect correction would produce harmonic peaks along a straight line. You can see that the corrected spectrum terms (in black) are much better but still far from perfect.
Adjustable Sampling Solution. If the data sampling is locked to the observed system frequency, a data set of a fixed number of samples corresponds exactly to a fixed number of fundamental cycles. This eliminates the FFT smearing, so windowing operations are not needed. The usual way of adjusting the sampling – estimating the power system frequency and controlling the sampling time clock hardware dynamically – is expensive to implement and carries its own set of problems. However, the Wave Synchronization Module available with the DAPtools Standard Software edition provides an alternative that achieves the required alignment without the special equipment.
Solution Strategy
There is insufficient room in this article to fully discuss the solution method, but the basic ideas can be outlined:
- use high sampling rates, to characterize the waveform accurately, minimize modulation distortions, and avoid aliasing effects;
- collect long data blocks for high resolution, isolating harmonic frequencies from the others, and attenuating random noise;
- align sampling rates to the current value of the power system frequency, so that the harmonic frequencies are kept in exactly alignment with the FFT, avoiding spectrum smearing effects.
To apply these ideas:
- Perform a timing analysis in real-time to determine where samples are needed.
- Resample the data [1] so that each power cycle is spanned by exactly the right number of sample positions.
- Optionally, apply special decimation techniques [2] to simplify the FFT, for improved processing efficiency. This is optional because some information about extraneous influences is lost.
- Follow up by performing the FFT analysis.
- Extract the harmonic terms to quantify the distortion.
The critical step in the sequence above is the resampling operation.
Suppose that the sampling rate is selected so that there are 5000 samples collected, spanning exactly 20 power cycles — at least this would be possible if the sampling is configured exactly, and the power system frequency remains exactly equal to the nominal power system frequency for the duration of the test. The actual operating frequency will not be exactly nominal, so the number of high-resolution hardware samples necessary to exactly match the actual 20 power cycles is N, a little lower or a little higher than expected. The analysis can then calculate the desired locations of samples.
0 * (N/5000)
1 * (N/5000)
...
4999 * (N/5000)
The 5000 selected sample positions exactly align to the 20 power cycles. What remains is the classical DSP problem of reconstructing signal values at any desired points in time, given a set of sample values. (The mathematical operations for this are discussed in another note [1] on this site, in the context of a slightly different problem of shifting all samples in time equally.)
A Packaged Solution
All of this might sound complicated, and it could be, except all of the hard work has already been done for you. Using the Wave Synchronization Module, you specify the nominal operating frequency (50.0 Hz or 60.0 Hz), and the rate used in the hardware configuration to capture the original high-resolution samples. The resampling operation then applies the DSP analysis to calculate the waveform values at the precise set of points you need.
You have some options about how to perform the subsequent processing.
- Send raw data. If you have sophisticated numerical processing software, stream the blocks of resampled raw measurement data, and let your software do the FFT number crunching.
- Let the Data Acquisition Processor do the work. It can precondition the data stream, for processing efficiency, and immediately apply the required FFT analysis. Or it could do even more, reducing the data to exactly the form and exactly the real-time rate you need for various data logs and graphical displays.
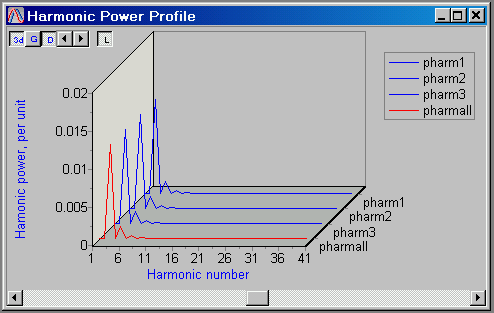
Any application software could then receive the data, but for illustration, the following is a snapshot of the DAPstudio application in action, accepting and displaying the results in real-time.
Conclusions
We have just seen that an analysis usually considered difficult and specialized is actually straightforward data capture and processing that an xDAP system can do routinely, on multiple channels, in real time. Instead of dealing with an undetermined number of samples spanning the desired power cycles at a fundamental frequency that isn't precisely known, followed by remedies to try to reduce the damage, you can instead use Data Acquisition Processor processing to adjust the sample set so that you receive data blocks accurately aligned to the fundamental frequency, making the analysis easy. Since the analysis is easy, you have options to perform all of the number crunching automatically and in real time, so that no additional analysis software is necessary.
You could pay a lot more and obtain a standards-conforming test instrument that can do the same things as the Wave Synchronization Module harmonic analysis, except with results that are considerably worse and not in real-time. If compliance with dated standards is what really matters, you might have to get a certified test instrument, accept the poor results, and pay the price. If you need demonstrably accurate results that are easy to obtain, the Wave Synchronization Module should have a certain appeal.
Footnotes and References:
- Time-Shift Filtering, a note on this site.
- "Window-presum FFT achieves high dynamic range, resolution," Charles C. Gumas, Personal Engineering, July 1997, p. 58-65. Unfortunately, out of print. Call us if you need details. Perhaps someday we will have a page on this topic?
Return to the Integrated Systems page.