Real-Time Vibration Analysis of a Model Suspension System
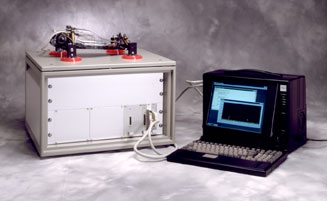
This scale-model shaker table demonstration shows how Microstar Laboratories products can control a sophisticated vibration system and analyze the results.
Microstar Laboratories engineers have developed an eye-catching demonstration system. The engineers took a regular R/C model car, removed the wheels, replaced each one with a block containing an embedded accelerometer to measure excitation, and embedded four more accelerometers in the chassis to measure the response – as damped by the suspension.
Each wheel-replacement block stands on an independent mount, held there by a permanent magnet. A Microstar Laboratories Data Acquisition Processor board sends an independently variable control signal in the range 5 to 25 Hz to each of the four mounts. An additional iDSC 1816 board measures these raw signals at the points of excitation – the four wheel-replacement blocks – to allow for any effect the mounting hardware has on the control signal. The same board measures the responses from the four accelerometers embedded in the chassis.
Real-Time Vibration Analysis
The system calculates FFTs in real time to display both the amplitude applied at each frequency, and the resulting amplitude sensed in the vehicle at each frequency – where the suspension has damped the vibration. The filters on the iDSC board have linear phase response; this feature allows direct comparisons at different frequencies.
The system also calculates a transfer function for the inputs and outputs. This transfer function models the frequency response of the vehicle to allow predictions of its behavior at any frequency.
The iDSC 1816 brings to PC-based systems the brick-wall filters needed for credible results in spectral analysis applications that require high accuracy over several channels: those that monitor vibrating and rotating assemblies in the automotive, aerospace, and power generation industries, for example.
A single PC running DASYLab provides a graphical interface and supervisory control for both the DAP board and the iDSC 1816. To simulate various road surfaces and speeds, the operator controls the vibration in each independent mount through virtual sliders on the graphical interface; these sliders logically connect to the DAP board analog outputs. All inputs come from the iDSC 1816.
The system calculates FFTs in real time to display both the amplitude applied at each frequency, and the resulting amplitude sensed in the vehicle at each frequency – where the suspension has damped the vibration. The filters on the iDSC board have linear phase response; this feature allows direct comparisons at different frequencies.
The system also calculates a transfer function for the inputs and outputs. This transfer function models the frequency response of the vehicle to allow predictions of its behavior at any frequency. In the real world, testing different mechanical configurations allows engineers to tune a suspension system for optimal performance over a wide range of conditions.
The iDSC 1816 used in the demo has these important features:
- data acquisition with 16-bit resolution, optical isolation, and anti-aliasing
- 8 channels with simultaneous sampling and independent filters
- onboard filters with flat passbands, linear phase, and steep roll-off
- wide-ranging cut-off frequencies, selectable by channel
- expansion to 112 channels in one PC (not used in this demo)
This combination of features brings to PC-based systems the brick-wall filters needed for credible results in spectral analysis applications that require high accuracy over several channels: those that monitor vibrating and rotating assemblies in the automotive, aerospace, and power generation industries, for example.
The accelerometers used in this demo, rated up to 10 kHz, obviously pick up all frequencies up to this level. Although the control signals, by design, do not exceed 25 Hz, they vibrate a rigid body and so almost certainly develop harmonics -- maybe not so high as 10 kHz, but in any case higher than half the sampling rate: 1K samples per second per channel, selected here from a maximum for the board of 51.2K samples per second on each of eight channels (409.6K samples per second overall throughput).
Any input frequency above the Nyquist frequency – half the sampling rate – adds a lower (alias) frequency component to the sampled data as an artifact, an error, in any analog-to-digital conversion. A technique commonly used to avoid corrupting data in this way involves separate low-pass analog filter hardware installed between the sensors and the A/D converters.
iDSC boards provide much better filters, and bring with them none of the tech support problems that tend to come with all-analog filters. The built-in filters on the new data acquisition boards from Microstar Laboratories have 96 dB stopband rejection; and they attenuate a signal by this much within one quarter-octave of the passband. With this attenuation, iDSC boards reject signals in the stopband right down to the sixteenth bit.
Browse other sample applications.